
A compa-ratio is one number: an employee’s pay divided by the midpoint of their pay range. An accountant earning $52,000 in a range with a $61,000 midpoint has a compa-ratio of 85%. She is paid 15 percent below the middle of her own range.
Tracked across a workforce, that one number answers the questions that otherwise arrive as hallway conversations and Council-meeting surprises: who is underpaid, where turnover risk is building, and whether this year’s raise budget is going to the people who need it. This guide covers how to calculate it, how to read it, where it fits in a Tribal government’s pay decisions, and the questions HR directors ask once they start using it. A companion worksheet at the end computes everything in this article from your own employee data.
The Compa-Ratio Formula
Compa-ratio = annual pay ÷ range midpoint.
That is the whole formula. The meaning behind it: the midpoint stands in for the market rate of the job, so the ratio expresses pay as a share of market. A ratio of 85% means the employee earns 85 percent of what the structure says the job is worth; 110% means 10 percent above it.
How to Calculate a Compa-Ratio
Three examples, using the same math:
- A salaried accountant earns $52,000. Her range runs $48,000 to $74,000 with a $61,000 midpoint. $52,000 ÷ $61,000 = 85%.
- An hourly maintenance technician earns $19.50. His range midpoint is $21.00 per hour. $19.50 ÷ $21.00 = 93%.
- The finance department’s eight employees average $58,900 in pay against an average midpoint of $63,400. The department’s average compa-ratio is 93%. Group averages are where patterns show.
If your structure uses steps rather than open ranges, use the middle step as the midpoint. If a job has no range at all, that is a finding in itself, and it is covered in the questions below.
How to Read the Number
A compa-ratio of 100% means the employee is paid exactly at the midpoint, which most structures treat as the market rate for a fully competent performer. The bands around it tell the story.
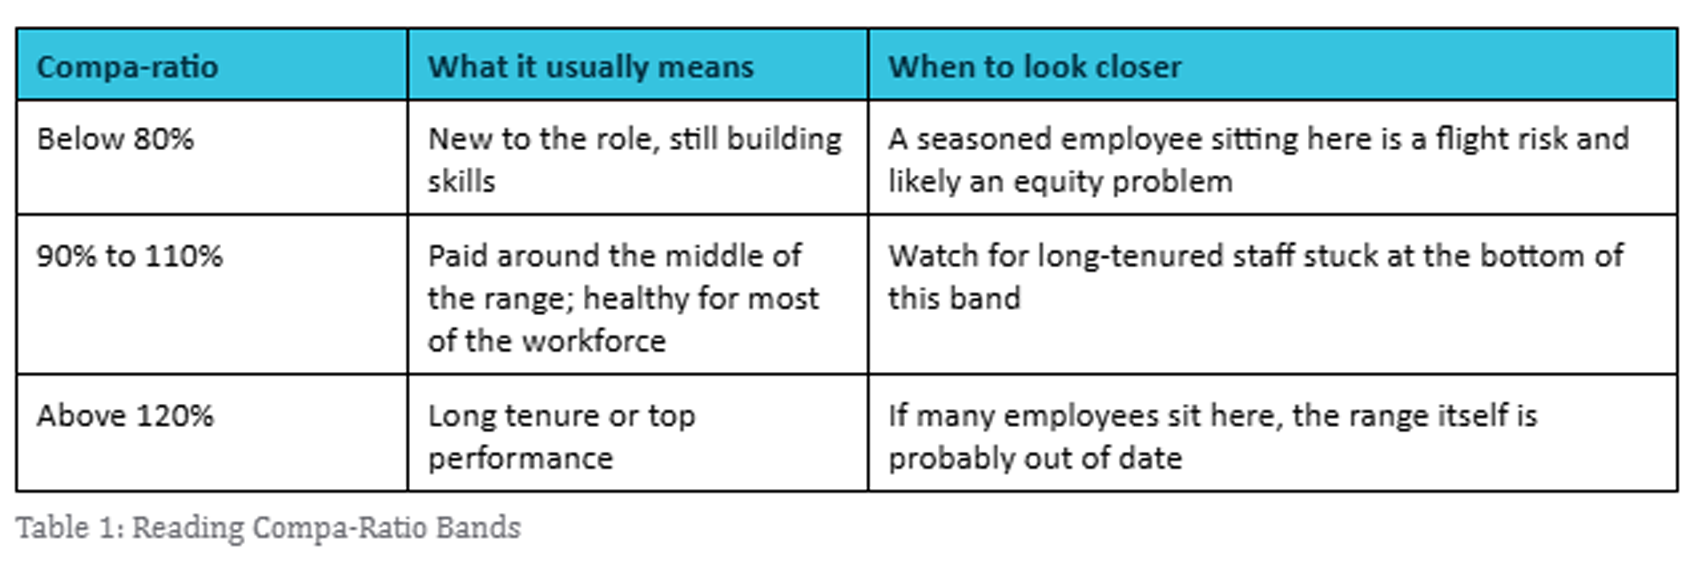
One caution before acting on any of these scenarios: they assume the range itself is right. A midpoint set in 2019 and never revisited will produce compa-ratios that look healthy while your best people take offers from the county, the hospital, or your own enterprise. The ratio is only as honest as the midpoint under it.
Why This Number Matters for a Tribal Nation
Pay questions reach Tribal Council as stories. A department director says her staff is underpaid. An employee compares his check to a cousin’s at the enterprise. A program manager warns that the clinic cannot hire nurses at the posted rate. Every story may be true, but Council cannot budget against stories.
A compa-ratio turns each story into a number Council can weigh and act on. It shows whether the accounting department really sits below its own structure, or whether one person does. It shows whether the clinic’s problem is its salary range or one hard-to-fill role. And when Council approves adjustments, the ratios document why, which protects the decision the next time it is questioned.
For Nations managing grant-funded positions, the ratio does one more job: it flags the roles where a fixed grant budget has quietly pinned pay below the range, so the gap can be planned for at renewal instead of discovered at exit interviews.
Compa-Ratio Analysis: Reading the Whole Workforce
One employee’s ratio answers one question. The analysis starts when you compute it for everyone and group the results. Say the Health department’s twelve employees average 91% while Administration averages 102%. That is not twelve individual pay conversations; it is one structural finding, and it usually traces to a hiring surge, a grant cap, or a range that lagged the nursing market. The grouped views that pay off:
- Department averages show which parts of the government are drifting below structure, and by how much.
- Ratios by tenure reveal pay compression: new hires near 100% while ten-year employees sit at 92% means the market moved and your loyal staff did not move with it.
- Merit budgets stretch further with a simple rule many structures use: employees low in their range with strong performance get the larger percentage; employees already above 110% get the smaller one. The raise pool goes where it corrects, instead of compounding what is already high.
- Budget modeling gets sharper. Bringing everyone below 80% up to 80% is a specific dollar figure, not a guess, and it is almost always smaller than an across-the-board raise.
Where a Trustworthy Midpoint Comes From
Since the midpoint carries the whole formula, it is worth saying where a good one originates. There are three sources, and they are not interchangeable.
- Published compensation data providers sell survey databases covering thousands of benchmark jobs. They are broad and statistically deep, but they describe general industry and government markets, not the employers a Tribal Nation actually competes with for people.
- Public sources, such as the Bureau of Labor Statistics’ National Compensation Survey and state wage data, are free and credible, but they run at the level of occupations and regions, not your labor market.
- An internal or commissioned survey prices your actual competitors: the Nation’s own enterprise, nearby Tribal governments, the IHS facility, the county, the school district, the regional hospital. It is the most work, and it is the only source that answers the question your employees are actually asking, which is what they could earn without moving.
In practice, a defensible Tribal salary structure blends them: published or public data for reach, a targeted market survey for the jobs you lose people from, documented so Council can see where every midpoint came from. When someone challenges a number, the source is the defense.
Questions Tribal HR Directors Ask
What does a compa-ratio of 85% actually mean for someone’s pay?
It means the employee earns 85 percent of the market rate the structure assigns to their job: on a $61,000 midpoint, $52,000, a $9,000 gap. Whether that is a problem depends on tenure. For a first-year hire, it is normal; for an eight-year employee, it is a retention risk with a price tag on it.
Should every employee be at 100%?
No. A healthy workforce spreads across the range: newer employees below the midpoint, experienced ones at or above it. The goal is that position in range tracks skill and tenure, not hire-date luck.
Can a compa-ratio be too high?
Above roughly 120%, pay has outgrown the range. Sometimes that is deliberate, such as a hard-to-replace specialist or a retention decision the Nation made with open eyes. When it is not deliberate, it usually means the range needs a market refresh rather than the employee needing a freeze. Look at the range first.
What if we do not have pay ranges, or do not trust the ones we have?
Then the compa-ratio has nothing honest to divide by, and that is the real finding. Ranges built from a current market study of comparable employers, including Tribal enterprises, IHS facilities, and surrounding counties, come first. This is the core of a compensation study, and it is the difference between a ratio you can defend and a ratio that argues with itself.
How often should we run it?
Once per budget cycle for the full workforce, and again for any job about to be posted, so the offer lands sensibly against current employees. The math takes an afternoon once the data is in one place.
Does it work for hourly employees?
Yes. Divide the hourly rate by the hourly midpoint. Just never mix an hourly rate with an annualized midpoint, which is the most common spreadsheet error in this exercise.
The Compa-Ratio Worksheet
The companion worksheet to this article does the computing. Enter each employee’s pay, hire date, and range, and it returns compa-ratio, range penetration, years of service, and a flag for the combinations worth attention, such as seasoned employees below 90%. A summary tab rolls the picture up by department. It is built for a Tribal government’s HR office: no add-ins, no formulas to write, sample rows to copy over.
Where Blue Stone Fits
Blue Stone Strategy Partners helps Tribal Nations build salary structures their Councils can defend, from market benchmarking through implementation. If you want a second set of eyes on what your compa-ratios show, our Human Resources team will walk through it with you. Write to info@bluestonestrategy.com or call (949) 476-8828.